Cycling Up 46% in 2020
8th May 2021
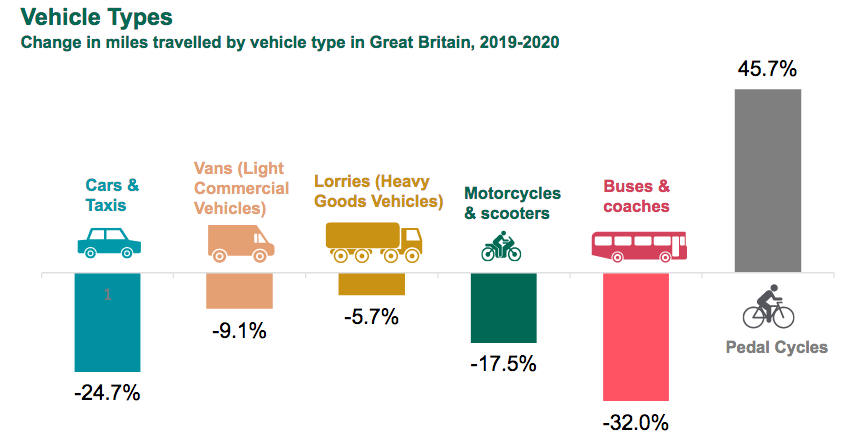
The DfT's Road Traffic Estimates: Great Britain 2020 show that pedal cycle traffic was up by 46% on 2019. Car traffic was down 25%.
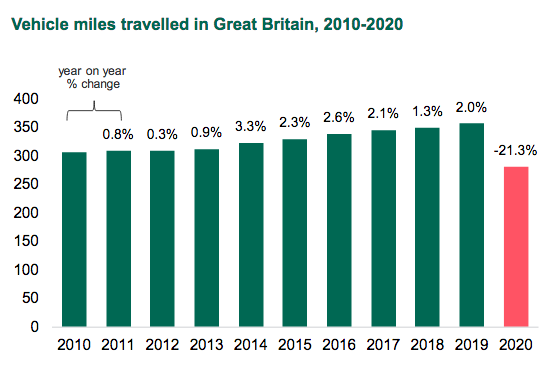
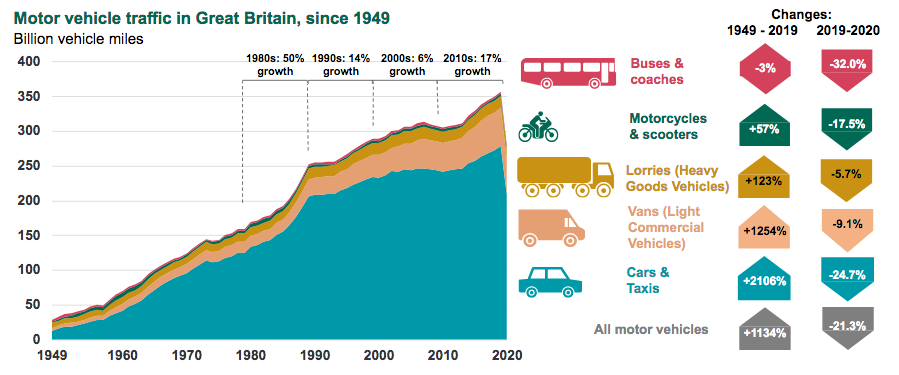
The document is full of illuminating information and graphics. For example, it shows that the decrease in motor traffic due to Coronvirus was in contrast to the trend to increased traffic over the last decade.
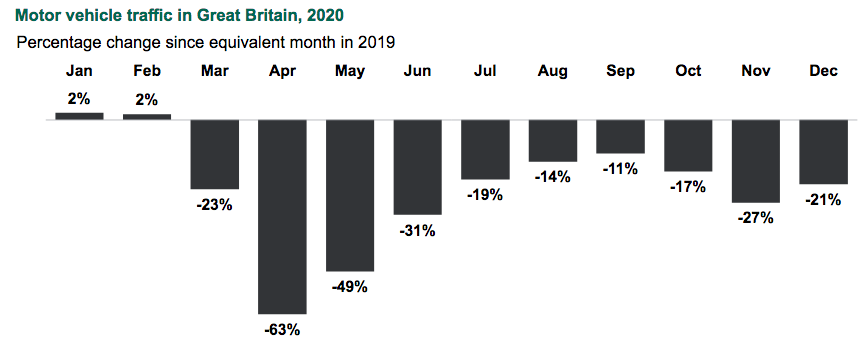
The reduction in traffic was most pronounced in April 2020, when the first lockdown took effect.
The traffic reduction according to road type was:
- Motorways -25.3%
- A Roads -23.2%
- Minor Roads -17.2%
UK CO2 emissions are estimated to have fallen 10.7% in 2020 compared with 2019.
Broadly, motor vehicle traffic has been increasing since records began in 1949, with the biggest increases in the period 1950-1989. The pandemic has had the biggest single-year impact in the whole of that period.
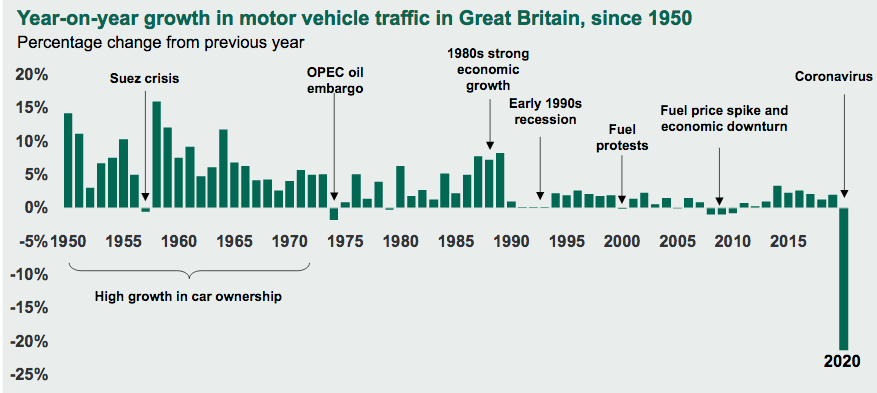
Between 1949 and 2019, motor vehicle miles increased from 28.9 billion to 356.5 billion.
Bike Rides in Harrogate and Nidderdale
Bike Rides in Harrogate and Nidderdale is a book of family, mountain and road bike rides.
"This guide is a wonderful companion whether you ride alone, with family or friends. Don't set out without it."
Read more about Bike Rides in Harrogate and Nidderdale.